

Slow decisions cost money. A purchasing manager waits until last month’s report to reorder stock. A sales lead bets on a hunch about which deals will close. By the time the evidence arrives, the moment has passed.
AI-powered predictive analytics fixes that. It uses historical data and statistical models to forecast what will likely happen next, so your team can act before problems grow and opportunities fade.
This guide shows how predictive analytics works, where it pays off, and how to build data-driven decisions into daily operations. You also get the common pitfalls and a practical roadmap for your first project.
What Is Predictive Analytics (and Why It Matters Now)
Markets shift faster than quarterly reviews can keep up with. Your systems already collect the raw material for better calls: orders, tickets, payments, clicks, and sensor readings. Companies that turn that data into forward-looking signals decide earlier than companies that wait for a report.
The gap shows up in results. In a McKinsey survey on customer analytics, companies that used it intensively were 23 times more likely to clearly outperform competitors in new-customer acquisition and 9 times more likely to beat them in customer loyalty. They were also 2.6 times more likely to report a significantly higher return on investment (45% versus 18%).
Predictive vs. Descriptive vs. Prescriptive Analytics
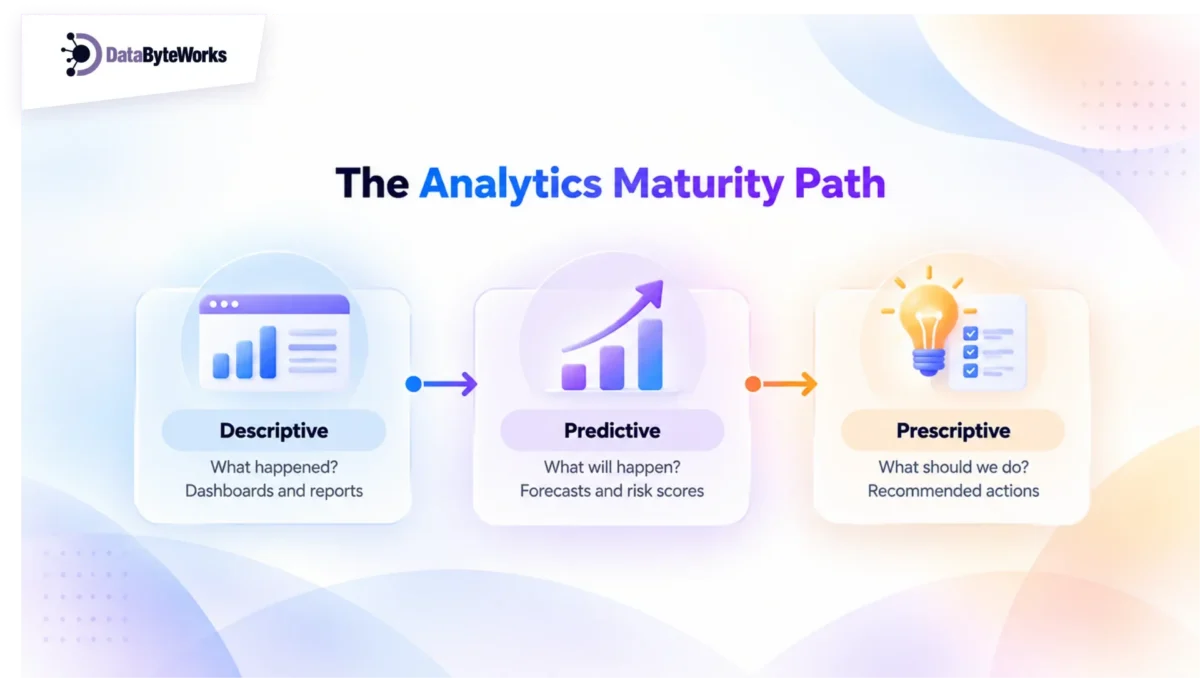
Each type of data analytics answers a different question. Most companies start with descriptive reporting, add predictive modeling next, and later grow into prescriptive recommendations.
ParticularsDescriptivePredictivePrescriptive
| Core question | What happened? | What will probably happen? | What should we do about it? |
| Typical output | Dashboards, monthly reports | Forecasts, risk scores, alerts | Recommended actions, optimized plans |
| Example | Churn rose 4% last quarter | These 40 accounts will likely churn next month | Offer these accounts a renewal discount before day 20 |
| Where it lives | Business analytics and BI tools | Predictive models on live data | Decision engines tied to workflows |
Figure 1: The analytics maturity path
How Predictive Analytics Works: Data, Models, Predictions
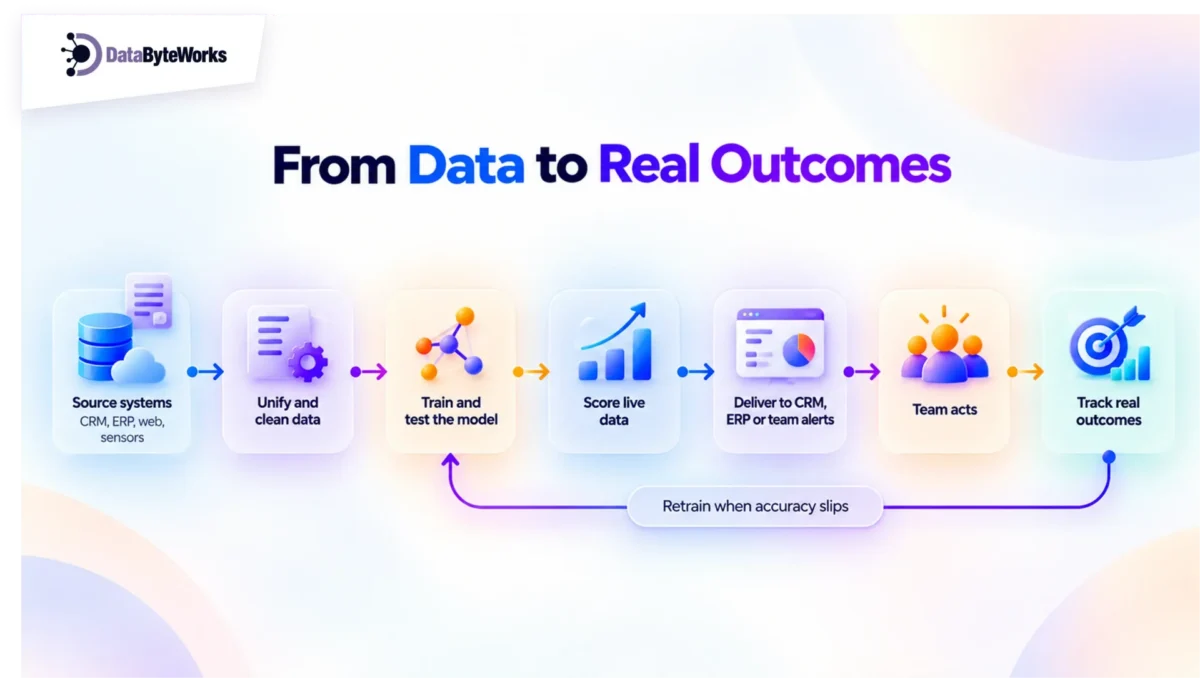
The process follows three stages:
- Data – You gather historical records where you already know the outcome, such as customers who renewed and customers who left.
- Models – Predictive modeling applies statistics and machine learning to that history. The model finds which signals matter, such as falling usage or late payments.
- Predictions – The model scores your current data and produces a forecast, a risk score, or an alert your team can act on.
Figure 2: From raw data to a decision, and back again
How Predictive Analytics Speeds Up Business Decisions
Speed comes from shortening the distance between a signal and a response.
From Reactive to Proactive Decision-Making
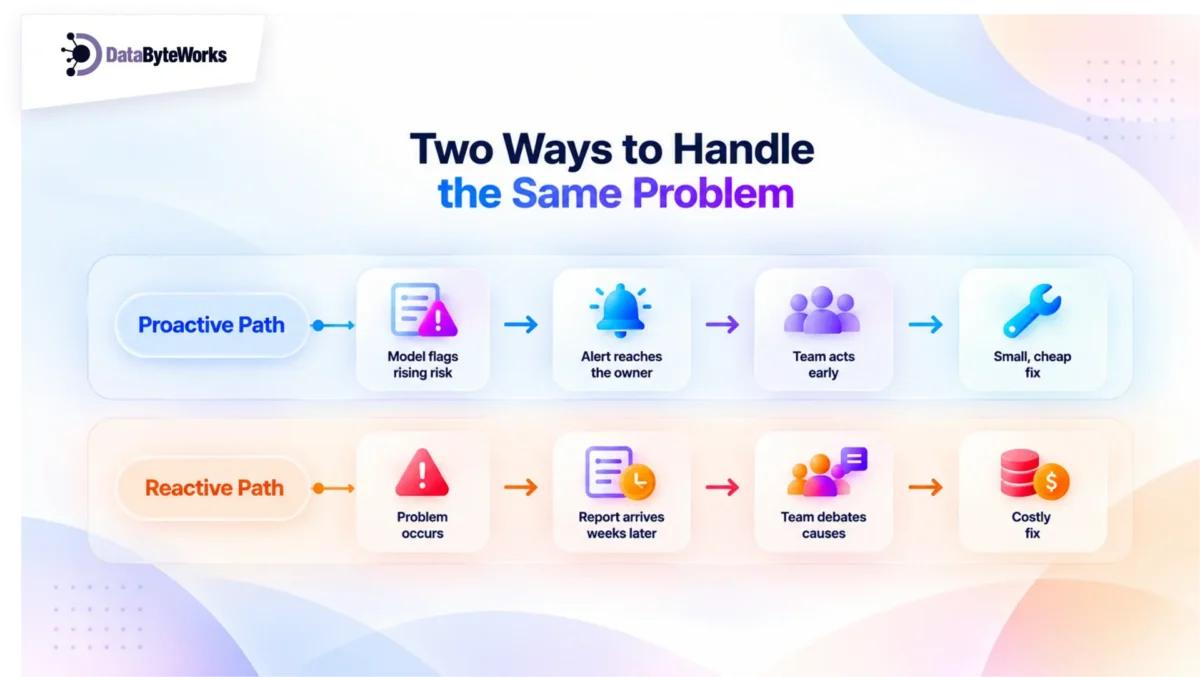
Reactive teams fix problems after they land. Proactive teams see them coming. A model that flags a slipping account or a failing machine gives you a cheap option today instead of an expensive repair next month.
Figure 3: Two ways to handle the same problem
Real-Time Insights Instead of Monthly Reports
Monthly reports describe a world that no longer exists. Predictive systems refresh continuously and push alerts to the tools your team already uses. Your analysts stop chasing spreadsheets and start acting on flags.
Reducing Guesswork and Decision Bias
Everyone carries blind spots. Managers favor the last deal they won. Teams trust the number that supports their plan. A model applies the same rules to every case, so your team debates evidence instead of opinions. That discipline makes data-driven decisions the default, not the exception.
Key Benefits of Predictive Analytics for Businesses
More Accurate Demand and Revenue Forecasting
Forecasts built on patterns beat forecasts built on last year’s numbers plus a guess. Finance teams plan budgets with tighter ranges. Sales leaders see pipeline gaps weeks earlier.
Lower Costs and Fewer Operational Surprises
Better forecasts cut waste on both ends. You avoid overstock that ties up cash and stock-outs that lose sales. Maintenance crews fix equipment before it fails, which protects uptime.
Better Customer Retention and Personalization
Churn models show which customers are drifting. Recommendation models show what each customer will likely want next. Your team reaches out at the right moment with the right offer.
Early Risk and Fraud Detection
Models learn what normal looks like, then flag transactions and behaviors that break the pattern. Your risk team investigates the handful of suspicious cases instead of sampling thousands at random.
Predictive Analytics Use Cases by Industry
IndustryWhat the model predictsDecision it speeds upData it needs
IndustryWhat the model predictsDecision it speeds upData it needs
| Retail and e-commerce | Demand by product and store; cart abandonment | Reorder points, pricing, timing of offers | Sales history, web behavior, promotions calendar |
| Healthcare | Readmission risk; appointment no-shows | Staffing, follow-up outreach, scheduling | Visit records, scheduling data (with strict privacy controls) |
| Finance and insurance | Credit risk; claim likelihood; fraud | Lending limits, policy pricing, claim review | Transaction history, application data, claims records |
| Manufacturing and supply chain | Machine failure; quality defects; supplier delays | Maintenance windows, rerouting, safety stock | Sensor readings, maintenance logs, shipment data |
Retail and E-Commerce
Retailers forecast demand by product and location, then set prices and reorder points accordingly. They also predict which shoppers will abandon a cart and trigger a timely nudge.
Healthcare
Providers predict which patients face a higher risk of readmission and which appointments will likely end in no-shows. Care teams then focus outreach and staffing where it counts. Strict privacy rules such as HIPAA shape how these projects handle data.
Finance and Insurance
Lenders score credit risk more precisely, and insurers price policies based on expected claims. Both use predictive models to catch fraud before they pay out.
Manufacturing and Supply Chain
Sensors feed models that predict machine failures and quality defects. Supply chain teams forecast supplier delays and reroute orders early.
How to Implement Predictive Analytics in Your Business
You don’t need a company-wide data overhaul. You need a clear sequence.
Define the Business Question First
Start with a decision, not a dataset. Pick a choice your team makes often that carries a measurable cost. Examples include “Which accounts should we call first?” or “How much stock should we order for next month?” A sharp question keeps the project focused and makes success easy to measure.
Prepare and Unify Your Data
Audit what you have, where it lives, and how clean it is. Pull records from separate systems into one consistent view. Fix the gaps that affect your chosen decision first, and leave the rest for later.
Choose the Right Models and Tools
Match the model to the problem. A simple regression may forecast sales well, while a more complex machine learning model may suit fraud detection. Start simple, test against outcomes the model has never seen, and add complexity only when it earns its keep. Our predictive analytics solutions cover this stage from data engineering to model deployment.
Deploy, Monitor, and Improve
Put predictions where people work: the CRM, the ERP, or a team channel. A forecast that sits in a notebook helps nobody. Track predictions against real outcomes every month, and retrain the model when accuracy slips.
If you want a second opinion before you commit a budget, AI strategy consulting can help you run an AI readiness assessment, compare candidate use cases, and pick the project with the fastest payoff.
Common Challenges and How to Overcome Them
ChallengeEarly warning signFirst fix
| Challenge | Early warning sign | First fix |
| Poor data quality and silos | Two systems report different customer counts | Name a data owner and standardize key definitions |
| Skills gaps and resistance | Staff ignore model alerts | Involve end users early and show how the model reached its call |
| Security, privacy, and compliance | Nobody can say who accesses training data | Add access controls, encryption, and audit logs from day one |
Poor Data Quality and Data Silos
Models reflect the data they learn from. Duplicate records, missing fields, and conflicting definitions weaken every forecast. Gartner reports that poor data quality costs organizations at least $12.9 million a year on average, and that 59% of organizations don’t measure data quality at all.
Assign data owners, standardize key definitions, and clean the sources that feed your first use case.
Skills Gaps and Change Resistance
Many teams lack data scientists, and many staff distrust a “black box.” Bring end users into the project early. Show them how the model reached its call, and let them compare it against their own judgment. Trust grows when people see the model hold up.
Data Security, Privacy, and Compliance
Predictive projects often touch customer, patient, or financial records, and the stakes are high. IBM’s 2026 Cost of a Data Breach Report puts the global average cost of a breach at a record $4.99 million, up 12% from the year before.
Build security into the design from day one. That means access controls, encryption, audit logs, application security testing, and secure data pipelines that protect information from source to model. A strong cloud and application security foundation, backed by regular vulnerability assessment, also helps you meet regulatory requirements without slowing the project down.
Building a Roadmap for Predictive Analytics Success
Start with a Pilot Use Case
Choose one use case with clear data, a decision owner, and a visible payoff. Run the pilot for 60 to 90 days. Compare the model’s calls against your current process and share the results openly.
Measure ROI and Scale
Tie every pilot to a business metric, and record the baseline before you start. Once the numbers prove the value, extend the model to the next use case and repeat.
| Use case | Baseline metric | What to track during the pilot |
| Churn prediction | Monthly churn rate | Churn among accounts the model flagged versus those it didn’t |
| Demand forecasting | Stock-out rate and overstock value | Forecast error against actual sales |
| Fraud detection | Losses per month; false-alarm rate | Confirmed fraud caught, and analyst hours saved |
| Predictive maintenance | Unplanned downtime hours | Failures predicted versus failures that occurred |
A written AI roadmap keeps that expansion in order, so each new project builds on the last one and your enterprise AI strategy stays connected to real results.
Ready to map your first use case? Book a consultation on AI strategy and roadmap planning to turn your data into a clear plan.